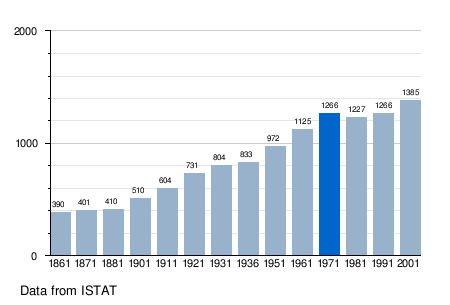
Lesson Plan: Creating a Bar Chart for Third Graders
Objective: Students will learn how to create a bar chart and use it to represent data. Materials:
- Large graph paper
- Markers or colored pencils
- Rulers
- Data to represent
- Show students examples of bar charts found in the world outside of the classroom, such as USA Today's Snapshots.3
- Explain that a bar chart is a simple way to present data to someone in a way that makes it easy to understand.3
- Discuss the importance of being able to read and
create a graph, as it builds a foundation for future understanding of
more complex data.3
- Review the parts of a bar chart, including the x-axis, y-axis, and bars.1
- Have students write 5-7 words or phrases that explain the process of creating a bar chart.1
- Divide students into groups of 3 or 4 and assign group roles, such as Recorder, Questioner, Organizer, and Encourager.1
- Provide students with data to represent, such as the number of pets owned by each student in the class.
- Have students work together to create a bar chart on
the large graph paper, using markers or colored pencils to make it
visually appealing.1
- Encourage students to take turns talking and working collaboratively.1
- Have students create their own bar chart using data they collect from a survey they create.3
- Provide students with graph paper, rulers, and colored pencils or markers to create their bar chart.2
- Instruct students to label the x-axis and y-axis, create bars to represent the data, and add a title to their chart.2


.png)
.png)
No comments:
Post a Comment